Website Performance Metrics: The only 3 metrics you need to track
Picking the correct website performance metrics is not the simplest task. It's easy to get lost, with all the data that is available.
Instead, you need to track the metrics that have the biggest impact on real humans in the real world. Not robots in a lab.
That's why there are only 3 metrics that you need to take into account and monitor.
These metrics all directly affect your users when they browse your site.

This post aims to demystify these metrics. Giving you the confidence that you're tracking the right data points.
To obtain the metrics we are going to use a free tool from Google called Lighthouse.
Lighthouse runs on your computer, in chrome.
I will explain step by step:
- Running an audit on any pages of your site
- What these metrics mean and also how they relate to real-world user experience
Before we dive into the metrics themselves, we need to understand how a website loads and how it affects user experience.
Website Loading Stages
There are three distinct stages a website goes through as it loads.
Each stage gives the user visual feedback, reassuring the user that the page is loading and its content is relevant.
These three distinct stages breakdown to:
- Page is loading
- Page has loaded
- Page is responsive
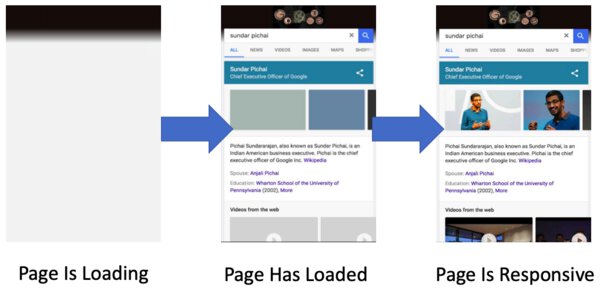
Let's take a look at these stages in more detail.
Stage One: Page is Loading
After the user clicks a link to your page they are presented with a blank white screen. At this point, their browser has sent a request to your web-server and it is waiting for a response.
Once the web-server has responded, you have an opportunity to present a visual change to the user.
Many websites at this point choose to show a slimmed-down version of the page.
Such as, changing the background color or adding a header. However, no text or images appear at this point as they take longer to load and we want our page to be fast!
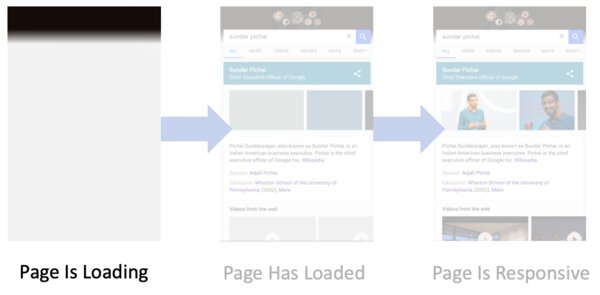
This first stage is crucial as it lets the user know that the page is coming.
We discussed in Website Performance Factors how it is important to load a page in under 3 seconds. If you don't 44.28% of your users will leave (bounce).
This is your first chance to show the user that there is some content coming, ultimately reducing the amount of bounce.
It stands to reason, the faster your page gets to this stage, the more likely the user will stay.
Stage Two: Page has Loaded
Once we have reached stage two, the user is now waiting for some text and images.
They want to know what content the site has for them. The user is still unsure if the page has the content they are looking for. There is still a chance that they can bounce.
We need to show them some content and quick.
This means showing a hero image, downloading fonts, displaying text and any style layout changes.
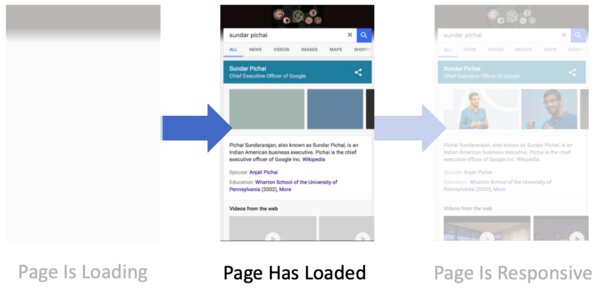
Once these files have been downloaded and the content is ready the user feels like the page has loaded.
Phew, we made it this far.
Stage Three: Page is Responsive
The user is still waiting, we have made it to stage three, the final loading stage.
This last stage deals with the user interacting with the webpage. Interaction can include starting a video, entering data in a text box, or scrolling through the content.
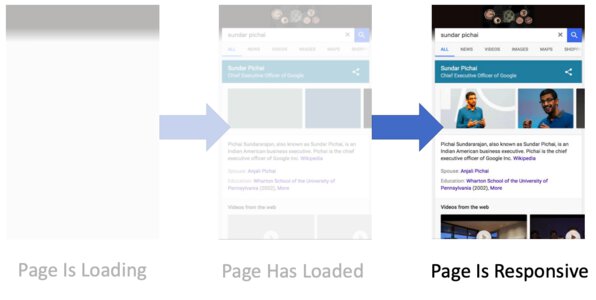
The speed at which your site allows these interactions is what makes a webpage feel fast and ready.
Once all the above is complete, the webpage has loaded. We have completed the stages.
Now let's find some metrics to match to each stage.
Gathering Metrics
As we mentioned earlier we can obtain metrics using the Google Lighthouse tool.
The tool comes with Google Chrome and you can access it using the Chrome Developer Tools.
To access the Chrome Dev Tools, right-click the webpage that you want to test and choose the “Inspect” option.
Now select the Audit tab. This tab might be hidden as it is towards the end of the options.
Once in the Audit section, you should see the lighthouse image and some “Audits” that you can perform.
As we are interested in website performance metrics, let's choose to do a mobile test. Select the mobile option, performance audit and on a simulated 3g network.
Click the “Run Audit” button when you are ready.
Once the test is complete you will be presented with some metrics and an overall performance score.
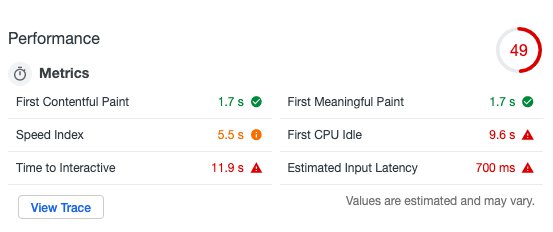
If this is the first you have seen these metrics it can be quite daunting.
It’s not clear how these metrics relate to real user experience and which ones we should care about.
Let's start with the metrics that cover the first stage of a website “Page is loading”
Page is Loading Metric
To track when users get to the “Page is Loading” stage we can use the First Contentful Paint (FCP) metric. This is an important milestone for users as it is the first indication that the page is loading.
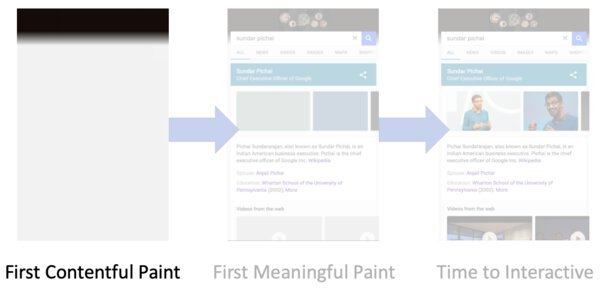
FCP measures the time from the initial click the user made to visit your site. Until the browser shows the first bit of content to the page. This is likely to be a background color change or header style.
Page has Loaded Metric
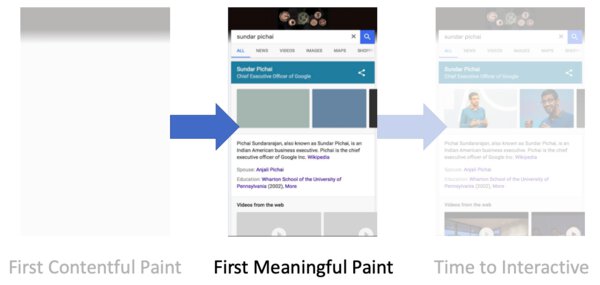
We can use the First Meaningful Paint (FMP) to measures when the page has loaded. This metric captures the time when the user feels that the primary content of the page is visible. At this stage, the user is ready to start interacting with the page.
Page is Responsive Metric
To indicate when the page is responsive to user interaction we can use the Time to Interactive (TTI) metric. This metric measures that the page can respond to a user clicking or tapping within 50 milliseconds.
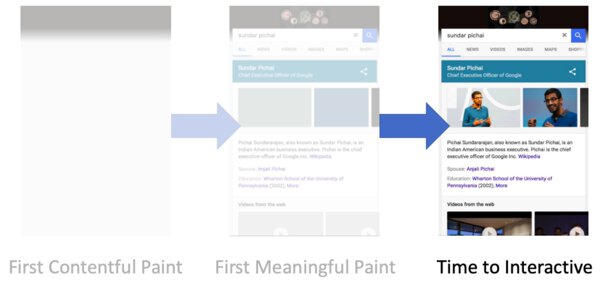
This metric is quite useful as an indication of how slow or unresponsive your site might feel to a user.
If you have had reports from users complaining of a sluggish site then pay close attention to this metric.
Wrapping Up, Website Performance Metrics
When looking at metrics we must always think about the users and their perception of speed. It’s not enough to look at just the data and make it faster.
Websites are built for humans, not robots.
By splitting website loading into three stages we can ensure that we are monitoring metrics that have a high impact on user experience. Reducing the metrics to 3, also helps us filter out the noise and focus on what matters.
Ultimately, we want to give the users the best experience possible and that should always be our goal with website performance.
Using Lighthouse we can track the metrics for our 3 stages:
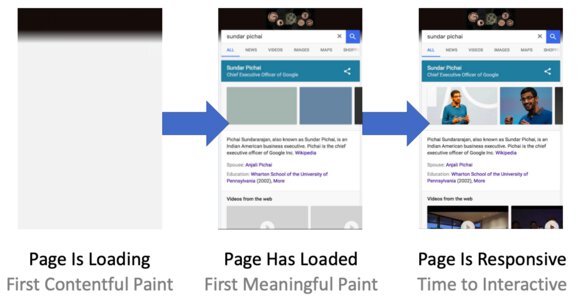
- Page is Loading - First Contentful Paint (FCP)
- Page has Loaded - First Meaningful Paint (FMP)
- Page is Responsive - Time to Interactive (TTI)
To find out how your site compares with the competition have a look at the Website Performance Benchmarks post.
